
LogHunt takes a pile of log files and answers the question an analyst actually has: what happened, to whom, and what do I check next?
It is not a SIEM, and I deliberately kept it from becoming one. It is the part of the workflow between “here are 9,000 log lines” and “here is the incident report”.
| |
The problem I was actually solving
Three things make log investigation painful, and none of them are fixed by writing a parser:
- An alert with no context is unactionable. “Brute force from 203.0.113.77” is background radiation on anything facing the internet. “Brute force, then a successful login, then a privileged command, then an encoded PowerShell payload — same address, twenty minutes” is an incident.
- A severity label cannot rank a queue. Twenty
HIGHalerts still leave you picking one at random. - The evidence is split across files that look nothing alike. The attack crosses the web log, the auth log and the Windows event log. Joining them is manual work.
How it works
Everything hangs off one decision: normalize first. Every parser — Linux
auth.log (syslog and RFC3339), Windows Security (Event Viewer text, CSV or
JSON) and Apache/Nginx access logs — emits the same 20-field event. After that,
one detection rule covers SSH and Windows event 4625 at the same time, without
knowing either format exists.
Format detection works by parser vote: every parser gets a sample of the file and whichever recognises the most lines wins. Filenames lie; content doesn’t.
Eleven rules across six families: brute force, login-after-brute-force, anomalous login source, privilege escalation, web attack, and suspicious process execution. Three judgement calls did more for the output quality than any extra rule:
- The binary isn’t the alert, the command line is.
cmd.exe /c dirislow.powershell.exe -nop -w hidden -enc <base64>iscritical. A flat “these binaries are suspicious” list produces a queue nobody reads. - Web findings say suspected. A signature match proves a payload was sent, never that it worked — so the HTTP status sits next to every finding. A 200 on an injection attempt is the thing that changes your day.
- Routine
sudoislowby default. An admin using sudo is the most common line in an auth log. That rule exists to feed a chain, not to page anyone at 3am.

The part I got wrong first
Correlation is the feature the whole project rests on, and my first version of it was quietly broken.
I grouped alerts by any shared entity — source IP, account, or host — within a time window. Host seemed obviously useful: a Windows process event carries no client IP, so how else do you tie it back to the logon that spawned it?
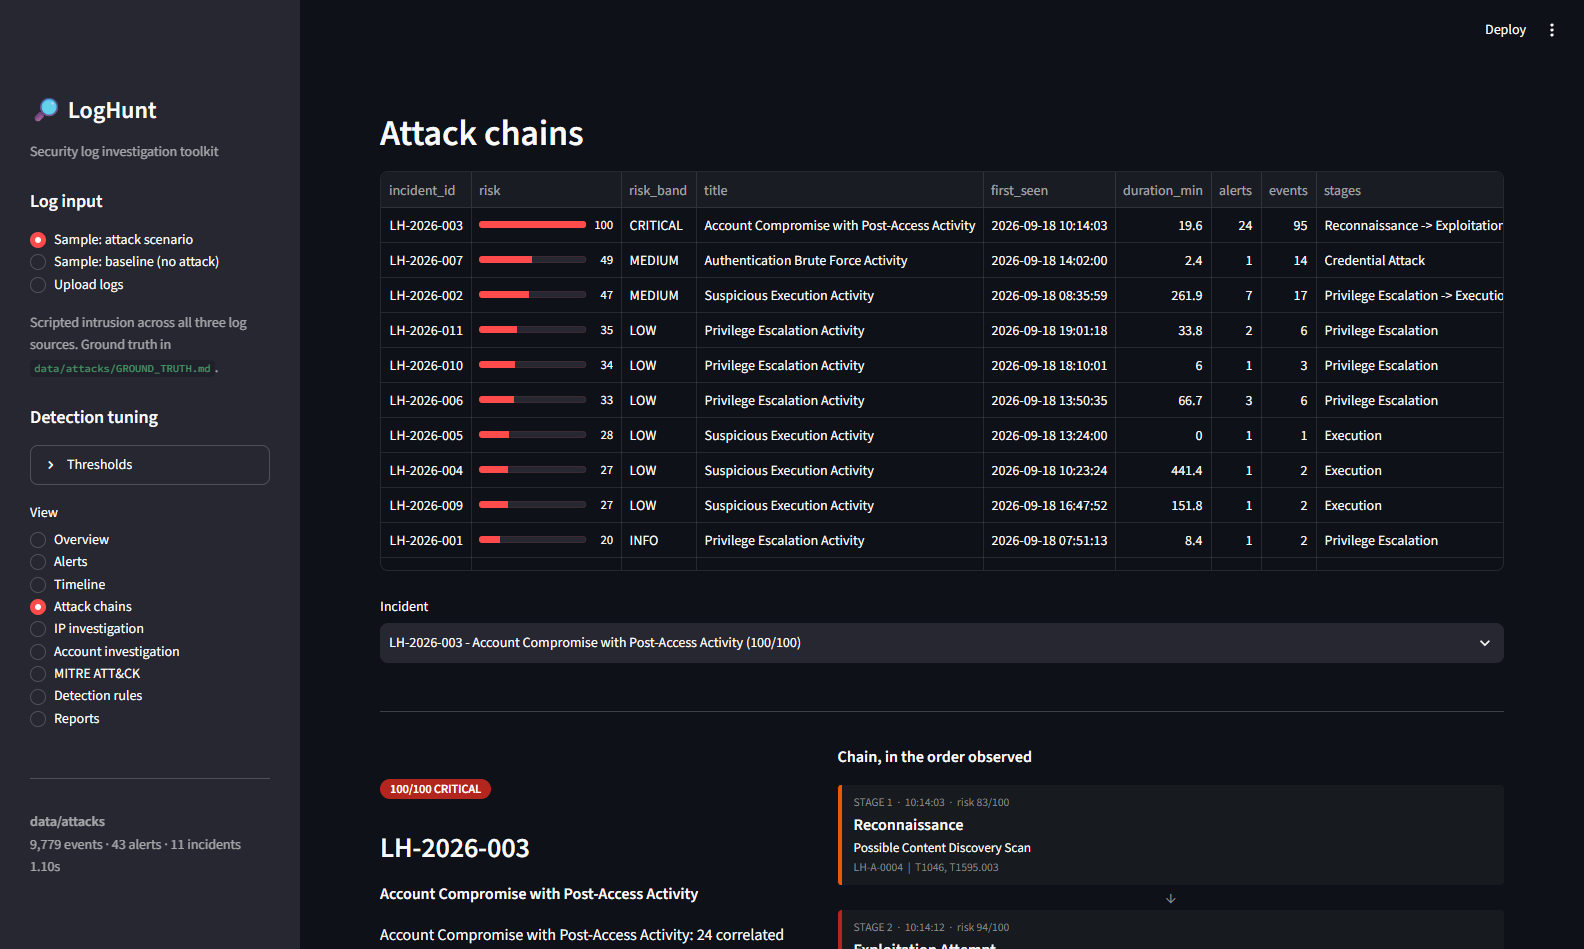
The result was one “incident” spanning 594 minutes and 33 alerts, which had
swept up an admin’s ordinary afternoon of sudo commands along with the actual
intrusion, because everything happened on the same two servers. Technically
correct grouping. Completely useless as an investigation.
Dropping host as a linking key gave me a clean 20-minute, 24-alert chain with the unrelated password-spray sitting in its own separate incident — and the cross-log-source links still held, because the attacker’s IP ties the web exploitation to the SSH brute force, and the account ties the Windows process events back to their logon.
The lesson I’ll keep: a correlation rule that groups more is not a correlation rule that works better.
Risk scoring you can argue with
Every score is base severity + frequency + context + correlation, capped at
100 — and the breakdown is shown wherever the number is:
| |
I found a genuine bug here by clicking through my own UI: the factors summed higher than the capped total, so the “why this score” table silently disagreed with the score above it. If you’re going to show your working, the working has to add up.
Correlation is a real feedback loop rather than decoration — alerts get scored, grouped into incidents, then re-scored now that the chain is known. The same 17-failure brute force scores lower on its own than it does when followed by a login and a privileged command. There’s a test that asserts exactly that.
Proving it works
This is the part I care about most. A detection tool that only ever runs on data containing attacks is a tool nobody has measured.
So the generator writes two datasets from one seed: an intrusion woven through a day of ordinary activity, and the same background activity with no attack in it. Ground truth is written out beside the logs, so every alert can be checked instead of admired.
| attack dataset | clean baseline | |
|---|---|---|
| Events | 9,779 | 9,669 |
| Alerts | 43 (16 critical, 5 high) | 18 — all low/info, zero medium+ |
| Attack-only rules that fired | 10 of 11 | 0 of 6 |
| Top incident | 100/100 CRITICAL — 24 alerts, 7 stages, 20 min, all 3 log sources | 47/100 MEDIUM |
The second column is the one that matters. Detecting the attack is easy if you don’t care how much you shout on a quiet day, and the tests assert both — detection on one dataset and silence on the other. Loosen a threshold and the suite fails.
The scripted intrusion runs from reconnaissance through to cleanup: 41 path
probes, SQL injection and traversal attempts, 17 failed SSH passwords for
admin, the password landing one second after the last failure, /etc/shadow
read via sudo, a UID 0 account created, then a jump to the domain controller —
RDP logon, encoded PowerShell download cradle, certutil transfer, SAM hive
export — and finally a new account added to Administrators and the security
audit log cleared.
LogHunt reconstructs all eight stages as a single incident.
MITRE ATT&CK, only where it’s earned
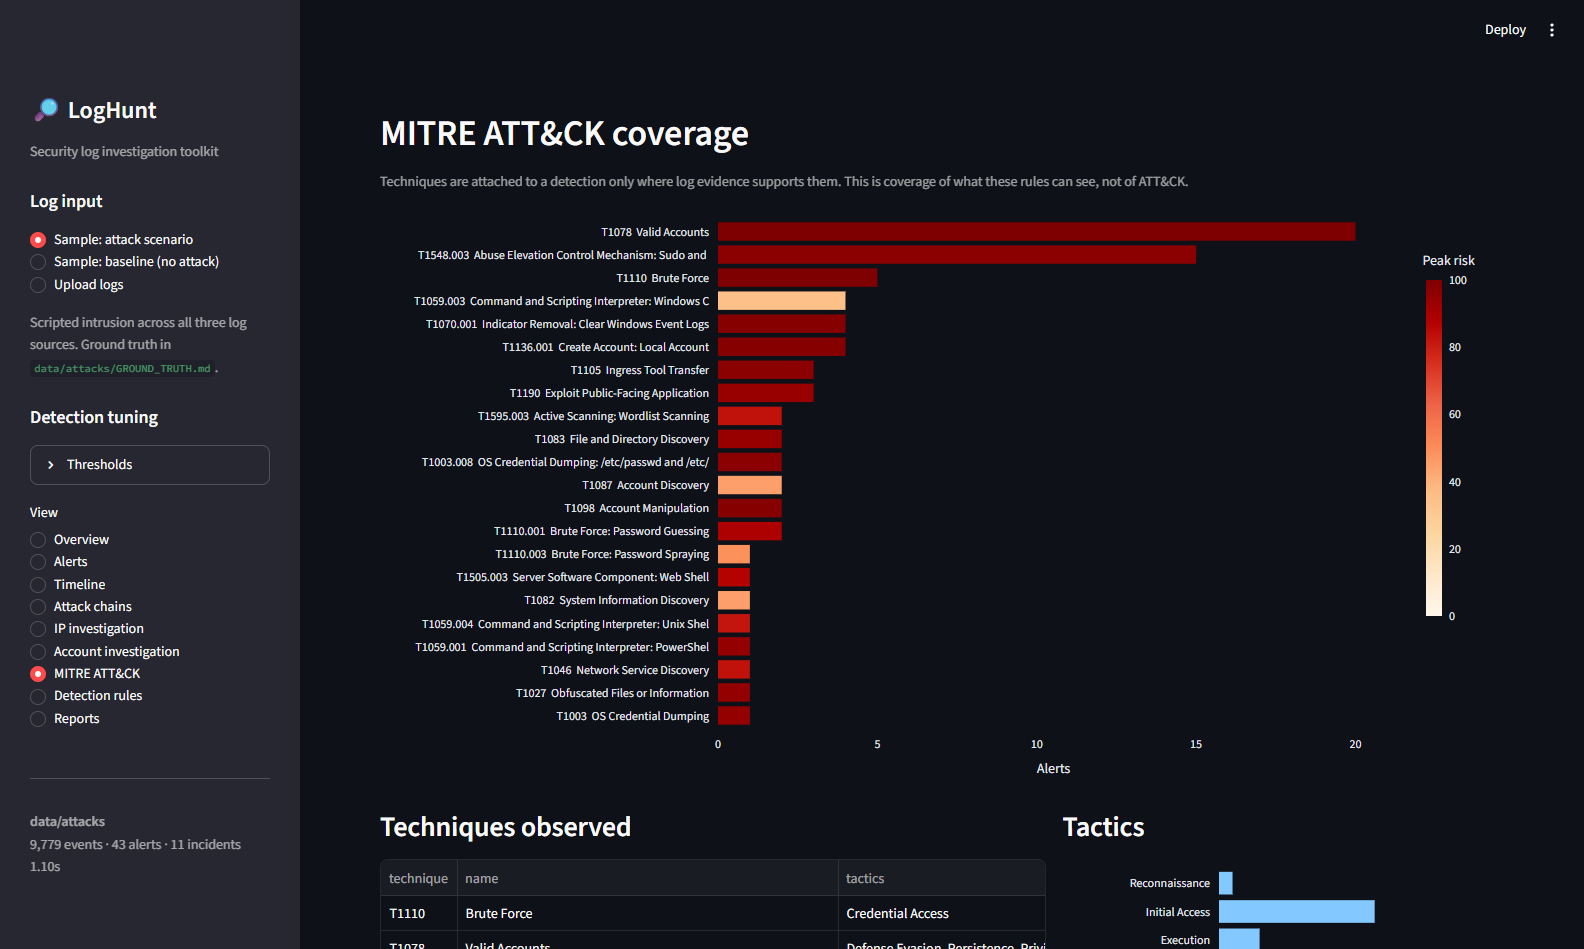
22 techniques come out of the sample scenario. I only mapped a technique where log evidence actually supports it — it’s easy to inflate a coverage chart by attaching techniques a rule can’t really prove, and it makes investigations worse while making the screenshot look better.
What it can’t do
Written down properly in the repo, because limitations you haven’t stated read like limitations you haven’t found:
- Detection is threshold and signature based. No ML. A patient attacker who stays under the thresholds goes unnoticed.
- A signature match proves an attempt. Confirming the SQL injection worked needs the application and database logs.
- Correlation groups on IP and account. Change both between stages and the chain breaks; share a NAT address and unrelated activity merges.
- A
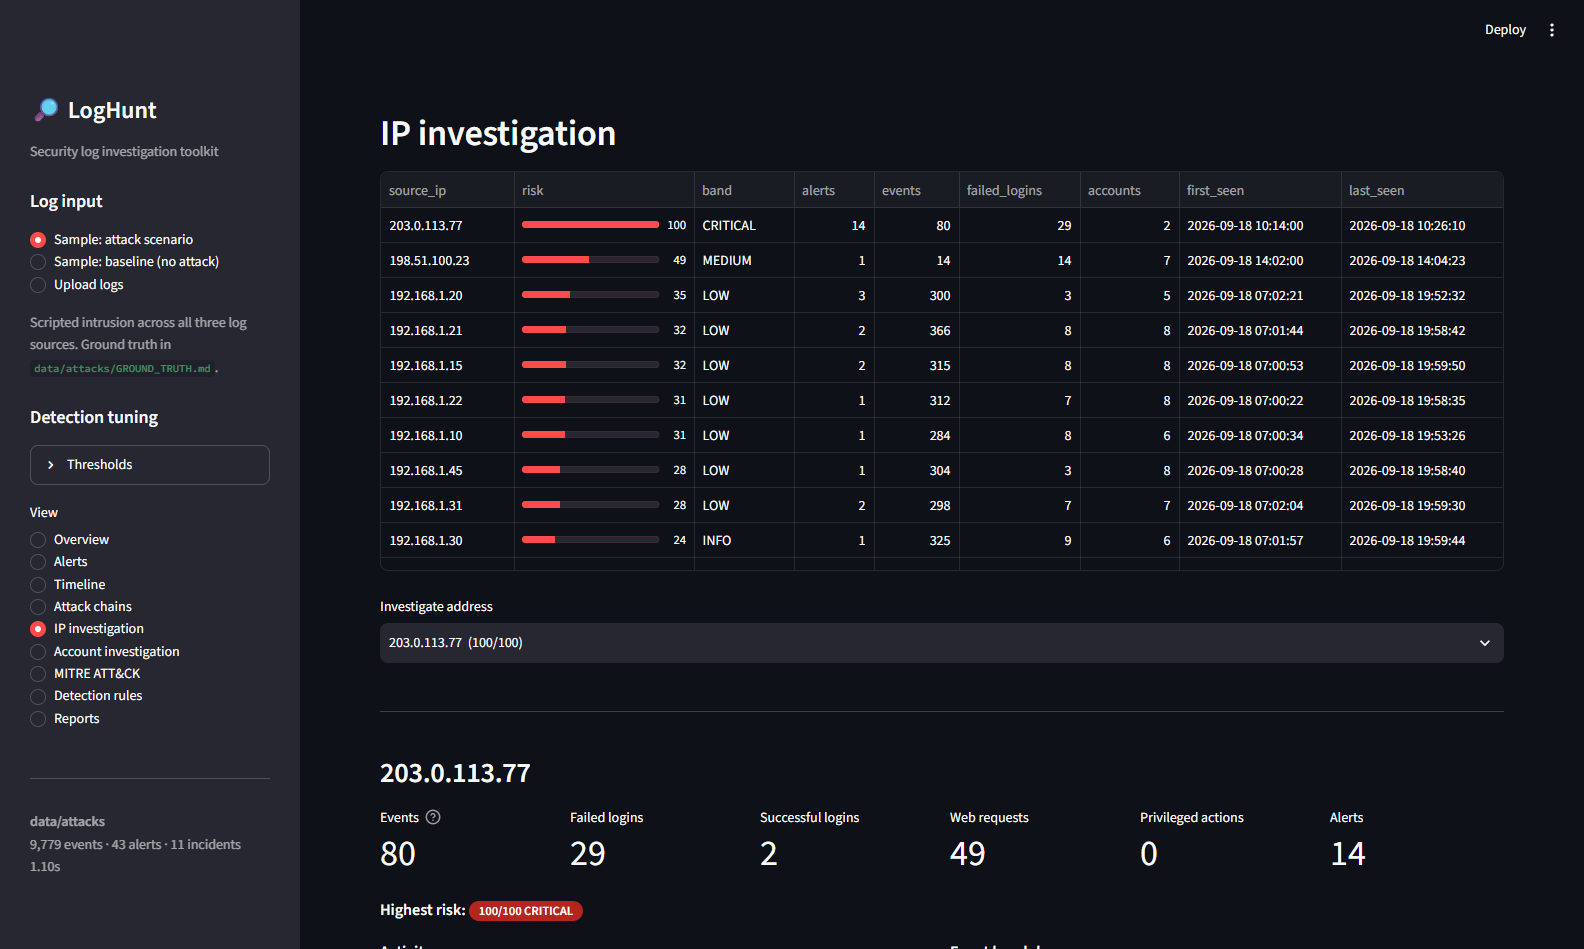
sudoline inauth.logcarries no client IP, so on the IP page an attacker shows 0 privileged actions even though the alerts for those actions are listed directly below it. Inferring the session IP is possible but guesses wrong when sessions overlap, so I left it out rather than fake the attribution. - The sample data is synthetic. It measures the rules against a known scenario, not against real-world traffic.
Next on the list: .evtx and Sysmon parsing, Linux session reconstruction so
sudo inherits its session’s source address, and Sigma rule import — the engine
already separates rule logic from the schema, so that one should slot in.
Why this one, next to the FYP
My Final Year Project is a context-aware IDPS — it detects and prevents web attacks as they happen. LogHunt is the other half of that story: investigating the evidence an attack leaves behind.
One stops the request. The other reconstructs what the request was part of. I wanted both sides.
Built in Python with pandas, Streamlit and Plotly. 80 tests, including end-to-end tests against ground truth.